 Here’s something that I’ve taken from a blog I did on how decisions are taken in public life and the role of media in supporting them (or not).
Economists have laboured for years to model the behaviour of markets. The models have become ever more complex and contain ever more parameters to help fitting the results to reality. They depend in the main on symmetric bell curves. In another post I relate how two financial insiders who had predicted the financial crash had a particular disdain for this approach, especially where it had gained Nobel prizes in Economics for their promoters.
One of these insiders, Nassim Nicholas Taleb, of Black Swan fame, identifies a hero among his many villains. It is Benoit Mandelbrot, the French mathematician, who is best known for his work on fractals. Multicoloured illustrations of his celebrated ‘set’ adorn many books and posters – and the top of this page where the image is linked from the bugman123 website. The fundamental fractal idea – that however closely you look at something it still has a complex structure – is a powerful one. For example a coastline seen from outer space has an irregular shape, but as your spaceship rushes towards earth and you resolve ever smaller scales, the shape remains irregular until you crash on the beach. As a mathematical idealisation, the one-dimensional coastline can be considered to have a higher spatial dimensionality intermediate between 1 and 2.
What is perhaps less known is that Mandelbrot applied these ideas to the financial markets and the results are summarised in his very readable book The (Mis)behaviour of Markets which contains some interesting insights. The most significant of these is that the behaviour of markets can be modelled by combining two simple random processes with very little fiddle factor fitting (to use the technical term). Mandelbrot’s book also contains a more measured account (than Taleb’s) of the failing of conventional economic wisdom and some interesting material on the application of his ideas to other phenomena such as flooding.
But getting back to the market, let’s start with a Brownian motion. Every millisecond a fly (or the price of Apple shares) makes a random jump, left or right, according to some rule, maybe the outcome of a coin toss. If you look at the overall movement of the fly (or share price) over a larger period, say every second, then you find that this is distributed according to a standard distribution, let’s call it a bell curve, which is actually quite narrow. For example although the fly has made 1000 jumps the chance that it is more than 100 jumps from where it started is very small (actually about 0.16%, about 1 in 600). The bell curve gets broader of course, but after 100 seconds it’s only 10 times broader than it was after 1 second, and the property that there is only a small probability of being much further out than a measure of its width stays the same. (Sorry, risk people, you know all this. As I said, it was written for a different audience.) That is why bell curves are so widely used in scientific and economic modelling. It’s a very powerful mathematical idea with just the slight drawback that it’s wrong. The changes in share prices over a given timescale are not distributed as a bell. Instead the distributions have what are called fat tails: there is greater probability of extreme movements than the bell curve (or normal distribution, or Gaussian as it is also known) would imply.
 As an aside, this Brownian motion has a neat fractal structure if you look at it in the right way. Assuming the change distribution over a specific timescale is defined and then assuming this is created by small changes over very small timescales, you create a path which has infinite length and a dimension of 1.5, using Mandelbrot’s definition.
As well as fat tails in the distribution of changes, the markets have episodes of intense activity and big changes interspersed with quiescent periods. You might call these cycles and build elaborate theories around them. You might argue that the next boom is around the corner since you are at the bust stage of newly resurrected boom’n’bust. Or you might argue – optimistically – that since GDP has peaked twice you are in a double dip recession as things can only get better.
So the next step is to make a small change in the model. Mandelbrot invents a concept called trading time. Sometimes trading time goes much faster than real time and there is intensive activity on the markets, with much greater changes possible within a single day, say. And sometimes the opposite is true.
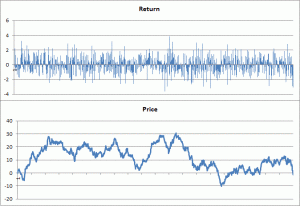
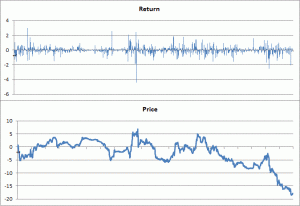
 The rate of change of trading time with real time is assumed to be random and this randomness has several timescales. Some changes which take place which are soon superseded by other changes, but others are persistent over long timescales, thus creating the flurries and quiescent periods. You can see the difference in the charts. The resulting model is ‘multifractal’ because it contains a spectrum of fractal dimensions.
Models of this type are remarkably successful at capturing market behaviour with minimal fiddle factor fitting as is best shown in a book by Mandelbrot’s closest collaborators. This book goes on to create simulations of this type with step changes in prices and to model the relationship between investor decision-making and market behaviour. (Beware though, unlike Mandelbrot’s book mentioned earlier which is a good read for all, this one is pretty heavy mathematical going.)
The significance of all this is that it sets the stage for Black Swans – extreme events which fall outside what are regarded as normal expectations, though Taleb would regard this as an abuse of the term. The occasional stock market crash is to be expected more frequently than you might otherwise think. Furthermore, trying to use market information to predict future movements is futile (though you might be able to make money by betting against someone who is aiming to do this).
What’s more trying to fit cycles to market behaviour is also futile. Although volatility is correlated over time, this correlation is random and can be reversed at any moment. Don’t rely on reversion to the mean to lift us out of recession. Obvious really.
As I noted, this article was prepared for a different audience not specifically concerned with risk. I’m aiming to enlarge on some of these concepts here at Clouds of Vagueness. The behaviour of markets does not have direct relevance to organisational risk management (unless you are a trading firm of some kind) but the thinking that Mandelbrot and his collaborators have brought to our knowledge of the way things work, in nature or society, is worth bearing in mind when we are compiling risk registers and thinking through how risks might play out. I’ll post more on this in due course. (Feel free to get in touch if you’d like copies of the spreadsheet which does the multifractal stuff.)

