Our starting point for thinking about risk mapping was a number of issues we are continually meeting in our consulting work:
In order to tackle these issues it seemed to be necessary to base both the risk register and the risk model on a more firmly defined system model. This should not only incorporate the risk issues, but also make them visible for critical evaluation. The model should be some kind of influence diagram, but the key question is to specify in more detail what the influence diagram should comprise – they are a very general tool. Some of the requirements for the risk map are:
Following from this it seems clear that an object oriented approach would be useful in that it would enable us to distinguish between objects – the entities that are important in building the risk map – and properties – the variables which will eventually be quantified in the risk model. The influences then become the methods which change the properties.
Approach and Issues

Click image to open in a viewer (which requires Flash).
The approach is to start by sketching out an influence diagram showing the key entities or objects which are important for risk, linking them with influence arrows as appropriate. Make sure you understand the nature of each influence is: what impact is implied for the target object and how the impact arises from the source object. Group the objects in a hierarchical way where possible, adding new collections, going deeper etc. As the map develops, think about the properties which describe the entities and are affected by the influences. Eventually the influences will have to link properties as it is these which will form the implementable, quantified risk model.
It is not the aim of the map to be complete, at least for business risk management. The objective is to show the main features which drive risk. In fact the model can be used to generate additional prompts to test whether the risk profile has been adequately specified. This is a technique used in workshops. But the risk map is not intended to be developed to a consistent level of detail. This contrasts with safety risk mapping techniques such as HAZOP where the intention is exactly that: to plough through a comprehensive process to ensure nothing has been neglected.
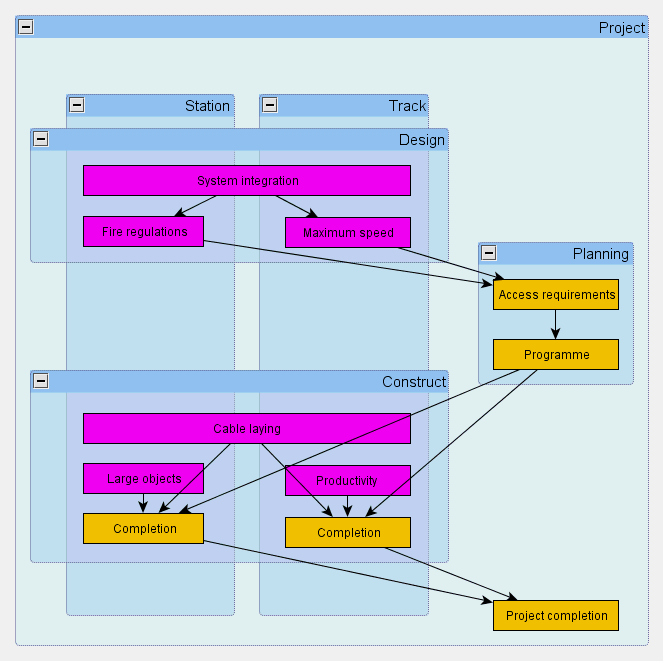
So far we have not mentioned risk explicitly. But this is simple: risk is an uncertain property of an object. The property can be a real variable, representing an uncertain quantity, or a boolean one, representing the occurrence of an event. Typically we indicate this by a different colour, as can be seen from the examples. The uncertainty flows through the model following the influences. The maps are drawn in such a way that the same is true even when the presentation is contracted.
We have also seen that the risk control measures can naturally be represented on the risk map and the use of decision nodes enables choices to made about the overall risk control approach.
There are various tools available to draw risk maps, but the best one we’ve found so far is yEd which permits a high level of modularisation through grouping and is particularly good for redrawing the maps in a minimally cluttered way. (And thanks to Matthew Leitch for pointing it out to me.) However we not yet found any graphing tool which covers all our requirements and this means there are still some problems:
Both these issues are illustrated in the chart: a highly simplified extract from a railway project. We want to look at the risk map both from an activity perspective (design, construct, …) and from an asset perspective (train, station, …). Typically there will be others such as contractor, discipline, location, etc. Planning and access management is an issue common to most activities, locations and assets and this creates quite a network of influences, even in this very simple idealisation.
We have some techniques to deal with these issues, but so far no definitive solutions or comprehensive methodology. As our experience grows we hope to be able to provide more definitive guidance on the way to map your risks. In time we may produce our own supporting software. But meanwhile we would be delighted to hear from others who have worked with these issues and would like to share their experience. See our contact page.
Alternatively you can return to the risk mapping page.
